

The ongoing changes of production and consumption in the power system requires a better understanding, This work package will explore measurement and pattern recognition methods and techniques for analysis in order to enable a more effective use of the power system. WP3 will develop, test and validate different methods to identify unwanted events in the power system, suggest recommendations for the development of predictive maintenance indicators and to enable the integration of renewable electricity production and increase flexibility.
Update 2017-06-16:
WP3 wants to be able to provide the service to both visualise and forecast electrical grid capacities and identify potential flexibility.Having such an overview and analyses of the grid’s various levels could be a valuable support for network planning, operation and maintenance.
WP3 also sees potential in optimising investments and cutting costs for grid operators.
Such a multifunction tool would also benefit other stakeholders, such as electricity traders, property owners, aggregators and suppliers, and create opportunities for new business models.
Update 1 december 2017:

WP3 work has resulted in several methods and calculations that are beneficial for several market actors. We believe these methods and calculations will provide valuable insight to the power grids capacity and its grade of utilization as well as insight into potential flexibility. We also found out that many benefits are achievable even without the investment of new equipment. With actual measurement equipment, we found methods to identify bottle necks in the distribution grid and when they appear as well as ways estimate rated power in different locations in the power grid. With these additional measurements we found methods to validate data and perform risk analyses. An example of a risk is the power grids rate of overbooked capacity.
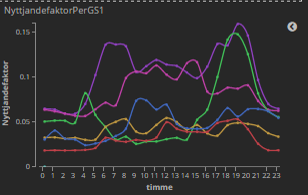
The practical use of pattern recognition and algorithms has been applied for clustering consumption. This data can be used to approach the potential flexibility of consumption locations and for demand response. The same data gives valuable insight to net planning and optimizing grid investments. Algorithms have also been used to forecast loads in different parts of the power grid.
Embriq has a web based prototype and a foundation to develop a multi tool for advanced analytics that could create several added values by combining data from existing sources. Our findings could be used for monitoring the low voltage power grid, suggest measures needed and help market actors adhere to regulatory requirements. This is why we see benefits for several market actors, end customers and the environment.
WP Leader:
David Westerlund
david.westerlund@embriq.se
Embriq, Norway
Metrum, Sweden
www.metrum.se
Eltek, Norway
www.eltek.com
Rejlers Embriq, Norway
www.embriq.no
Enerjisa, Turkey
www.enerjisa.com.tr
Glava Energy Center, Sweden
www.glavaenergycenter.se
MälarEnergi, Sweden
www.malarenergi.se
STRI, Sweden
www.stri.se
Smart Grids Plus ERA-Net
www.eranet-smartgridsplus.eu
Swedish Energy Agency
www.energimyndigheten.se
The Research Council of Norway
Tübitak
www.tubitak.gov.tr
Horizon 2020
www.Ec.europa.eu/programmes/horizon2020
- Prediktor
- Municipality of Arvika
- Pöyry
- University of Borås
- University of Dalarna
- Karlstad University